Clear numbers instead of guesswork.
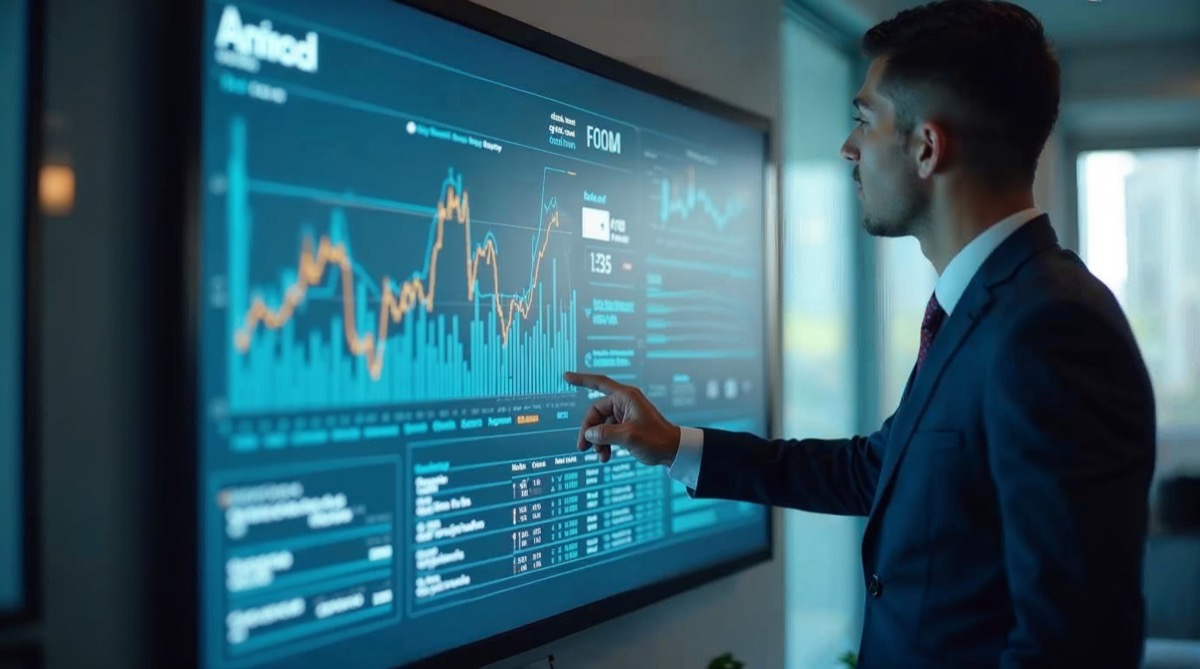
Without reliable data, every content decision is a guessing game. GrowAlta builds a clear reporting layer for your brand: which formats work, which channels turn reach into results, and where budget is not landing right now. Instead of gut feeling you get dashboards that show every week what we are working on and why — presented clearly, not buried in raw data.






KPIs that match your goals
Instead of tracking every metric available, we define together the handful of KPIs that actually reflect your goals. This keeps the focus on what matters, instead of getting lost in numbers.
Dashboards built for real use
One central dashboard bundles every relevant channel in a single place. You no longer have to jump between five platform views just to keep an overview.
Attribution across channels
We map out which post, which campaign and which channel actually contributed to which outcome — instead of crediting success to the last click alone.
Learning loops, not one-off reports
Every report ends with concrete next steps. Insights flow straight back into content planning and campaign steering instead of just being filed away.
Transparency, plain and simple
You see the same numbers we see, presented with the same clarity — no polished excerpts, no walls of jargon. What works gets shown. What does not, gets shown too.
Why gut feeling gets expensive in content marketing
Many teams post by feel: whatever landed well last time gets repeated, whatever flopped gets quietly forgotten. The issue is not instinct itself, it is that instinct without data is rarely reproducible. A post may have worked for completely different reasons than the team assumes — the wrong timing, a seasonal effect, a one-off external mention.
Without clean data, mistakes that could long since have been spotted keep repeating. Budget keeps flowing into formats that generate plenty of interaction but barely reach the actual target audience. Time keeps going into channels that create attention but nothing measurable in return.
The real cost of missing reporting is therefore rarely one single bad call, it is the sum of many small ones. Over months this adds up to significant wasted budget and missed reach that clearer data could have avoided.
This is exactly where GrowAlta starts: before we recommend new measures, we first build the data foundation that shows what is actually working right now — and what only looks like it is working.
The right KPIs for the right goals
Not every metric is relevant to every goal. A brand still building its presence needs different signals than an established brand mainly nurturing its community. We therefore do not start with a list of available metrics, but with the question of what success concretely means for your business.
From these goals we derive a manageable set of guiding KPIs: reach development over time, engagement quality rather than raw engagement volume, growth of the relevant audience, and the development of enquiries or website traffic from organic channels.
These guiding KPIs are complemented by supporting metrics that explain in the background why the guiding KPIs move the way they do — publishing times, format mix or response times in community dialogue, for instance. This keeps reporting focused without being blind to underlying connections.
We are equally deliberate about what we do not put front and centre: raw audience-size numbers without context say little about real business success. We consistently focus the view on metrics that actually connect back to your goals.
Dashboards people actually read
A dashboard is useless if nobody opens it. That is why we build reporting surfaces that show the direction of travel at a glance, instead of presenting tables with a hundred columns. Trends become visually obvious, outliers stand out immediately, and the most important question — are we doing better or worse than last month — can be answered in seconds.
All relevant channels come together in one place. Instead of switching between several platform-native insight views, you see development, comparison and trend bundled together — exactly in the form actually needed to make decisions.
We also adapt the presentation to the audience of the report. A dashboard for the operational team contains different details than a summary for leadership. Both views draw on the same underlying data but deliberately differ in depth and language.
Access is ongoing, not just at month-end. You can check in yourself at any time instead of waiting for the next scheduled meeting whenever a question comes up.
Attribution: knowing what actually worked
One of the hardest questions in social media marketing is: what actually triggered an enquiry or a conversion? It is rarely just the last click. Usually there is a post at the start that sparks attention, several touchpoints in between that build trust, and a final trigger that leads to action.
We map this path as cleanly as is technically possible, instead of crediting success to the last visible step alone. Concretely, this means linking channel data, campaign tags and website analytics to draw a more realistic picture of the customer journey.
This perspective often changes how budget gets allocated. A channel that appears to deliver few direct conversions at first glance can turn out to be a decisive first touchpoint — and therefore deserves more budget, not less.
We are honest about attribution's limits here: platform restrictions and privacy rules set technical boundaries. Where uncertainty exists, we communicate it openly instead of faking false precision.
From report to next decision
A report that only describes is half the job. Reporting only fulfils its real purpose once numbers turn into a concrete next action. That is why every recurring report we produce ends with clear next steps, not just a summary of what already happened.
This learning loop runs continuously: a format that performs above average gets scheduled more often. A publishing time that yields little gets adjusted. A campaign that is not performing as expected gets corrected early instead of being run to the end regardless.
Speed without haste matters to us here: we react to data without throwing the whole strategy overboard at every small fluctuation. Short-term blips get distinguished from real trends before any decisions are made.
That is how reporting becomes what it should be: not a rear-view mirror, but a steering instrument that makes every following decision a little better than the one before it.
Domande frequenti sull'agenzia
Which tools do you use for analytics and reporting?
We combine each platform's native analytics tools with a central dashboard that brings all channels together. The exact tools used depend on the systems you already have in place.
How often do we get a report?
The standard is a regular reporting rhythm with ongoing dashboard access in between. We align the exact cadence with your team — some prefer weekly, others monthly reviews.
Do you show us when something is not working?
Yes, explicitly. Transparency to us means disclosing weak results too — otherwise nothing can be learned or corrected from them.
Can we have our own metrics added to the reporting?
Yes, the dashboard is tailored to your goals. If a particular metric matters especially to your business, we build it in.
Does our team need technical background to understand the reports?
No. We design dashboards and reports to be understandable without analytics experience, and we explain the key insights in plain language in every review.
Pronto per una crescita reale?
Clear data beats gut feeling every time. Let us build your reporting so you can see what actually works.
Inizia a crescere oggi